As part of my project work with The Keller Fay Group, I have access to interesting word of mouth (WOM) data on the brands and product categories Americans talk about.
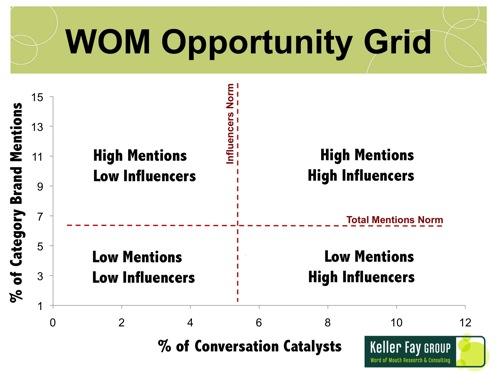
To coincide with the Super Bowl advertising game, Keller Fay plotted out a 2×2 “WOM Opportunity Grid” showing the talkability of product categories. This grid is divided into four quadrants pinpointing which product/service categories are the most mentioned in brand-related conversations happening in America. This grid also layers on where marketers can find the highest concentration of Conversation Catalysts(TM), those Americans who disproportionately drive word of mouth conversations about brands.

Conversely, the WOM Opportunity sour spot is in the lower left-hand quadrant where fewer brands get mentioned in less conversational product/service categories and where fewer influential consumers exist.
To tie this back to Super Bowl advertising, I had Keller Fay pinpoint where the major product/service categories fall on their WOM Opportunity Grid. >> LEARN MORE